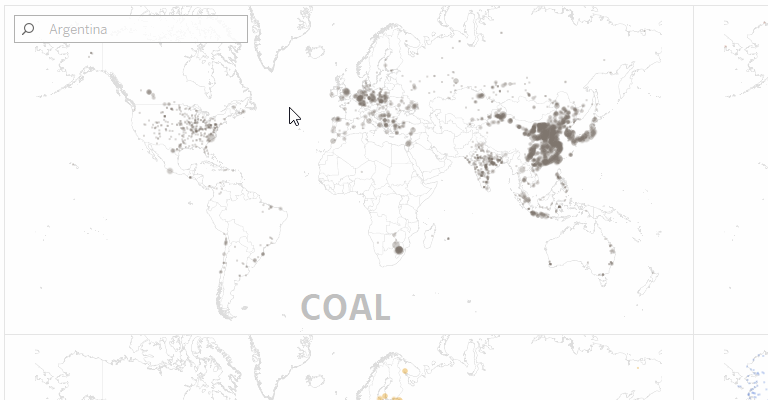
The new Map Layers feature allows you overlay multiple marks layers on a map removing the need to use a dual axis and opening up new possibilities for visualising multiple sources of spatial data.
Tableau Map Layers
Notes on Tableau and Data Visualisation
The new Map Layers feature allows you overlay multiple marks layers on a map removing the need to use a dual axis and opening up new possibilities for visualising multiple sources of spatial data.
If you have latitude and longitude fields in your data, you can create tooltip URL actions to open Google Maps in a browser at the exact location of those fields for any row in your data. This blog walks through how to create these links.
This post explores different parameter configurations and the resulting user interface elements that are available for each, then shows how a parameter can be used to swap the visible chart on a dashboard.
This post walks through how to create a basic custom Mapbox map, publish it and import it into Tableau Desktop for use as the background to a visualisation.
In this guest blog post Tamás Varga explains how you can create charts within a hexmap; a technique he used for a recent #MakeoverModay visualisation. Tamás also shares some of his design process and sources of inspiration.
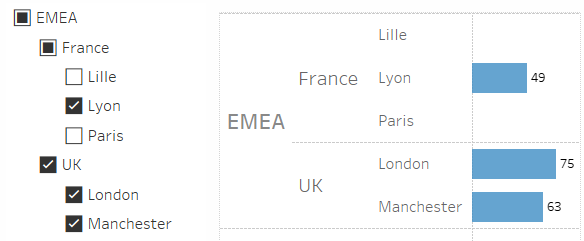
This post explores an approach for implementing hierarchical selections in Tableau which can be used for filtering and highlighting.
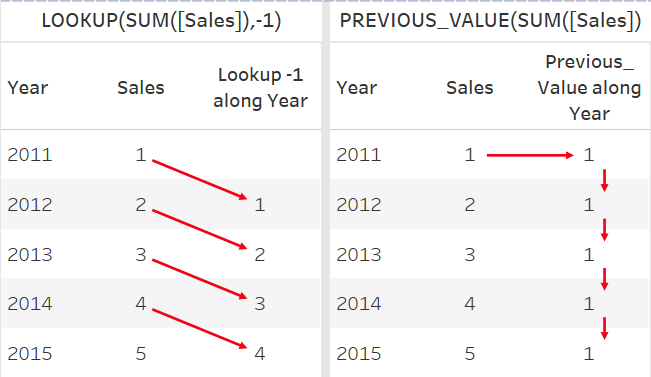
The PREVIOUS_VALUE table calculation can be used to make custom versions of running sum calculations and generate comma separated lists of items. This blog gives an overview with these and other examples.
What is a mark ID? How are they created and how to they impact animation in Tableau? How do you create custom animations? This post aims to answer these questions and provide an understanding of the core concepts of animation in Tableau.
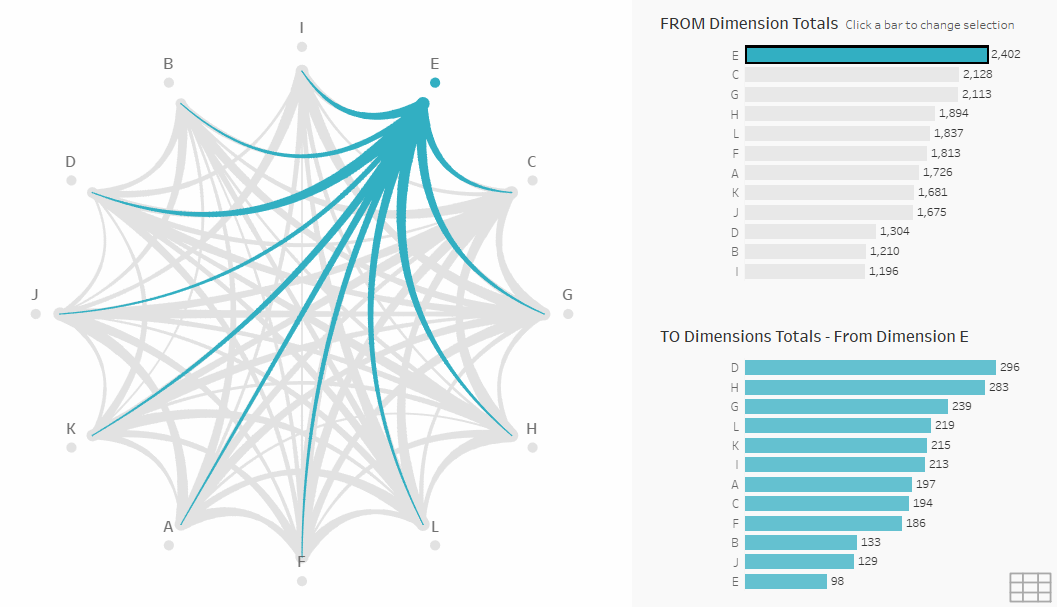
Chord diagrams show, in a circular form, the inter-relationships between entities in a matrix. This post describes a method for creating a chord diagram using Tableau Prep and Desktop templates.
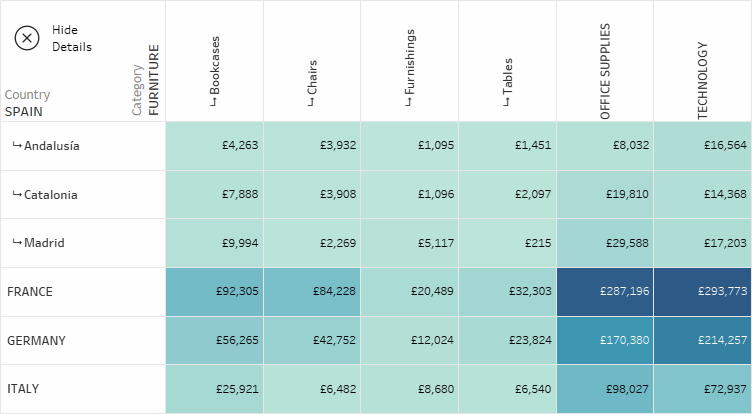
This post walks through how to create a drill-down table in Tableau so you can see different levels of granularity at the same time as well as how to create a custom button to go back to the default view.
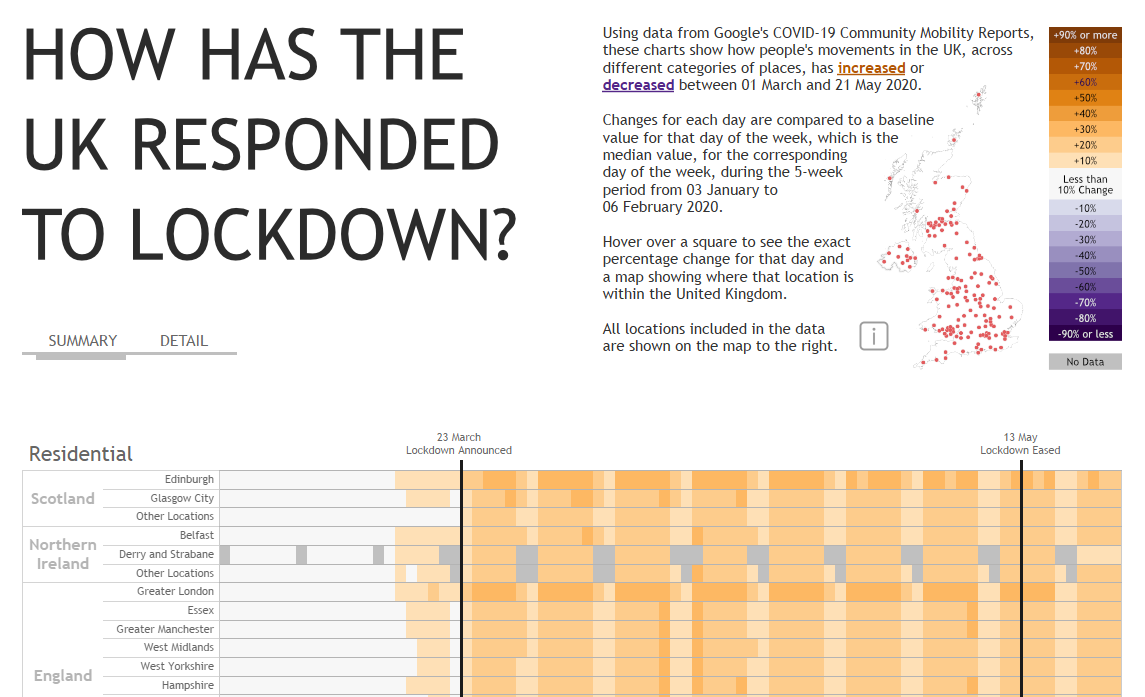
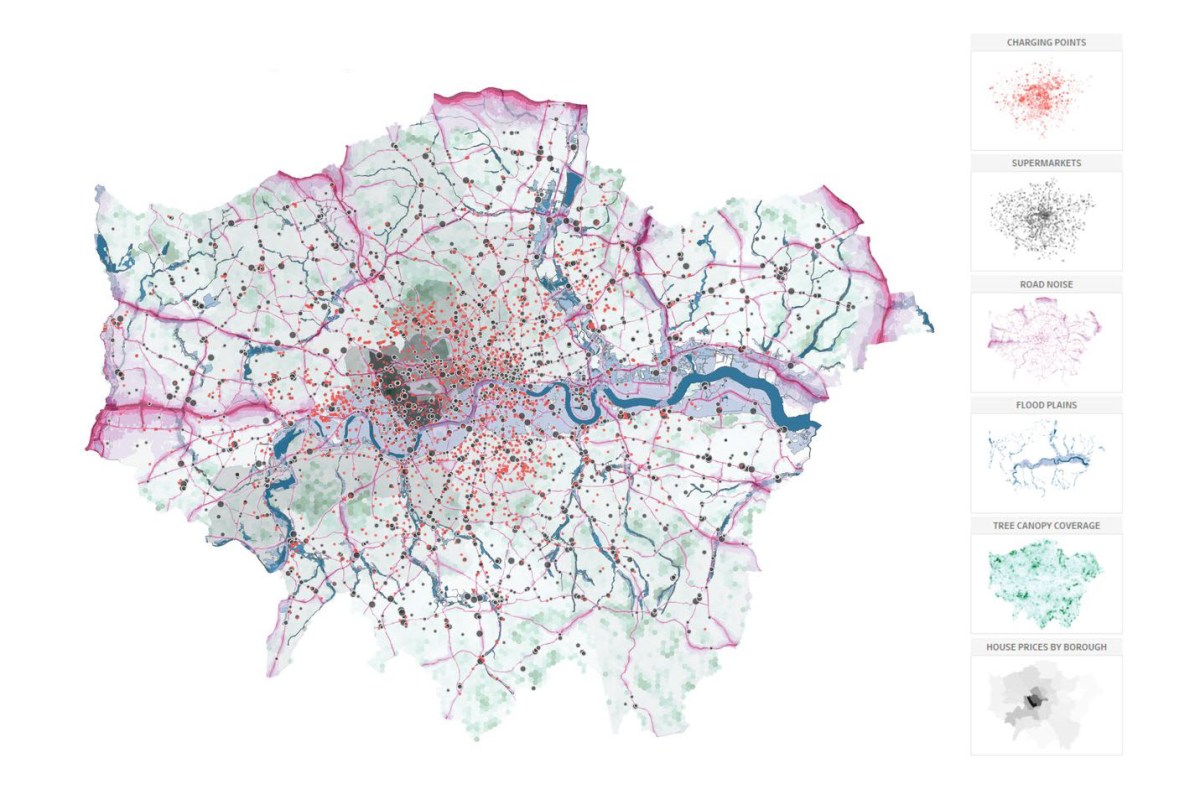
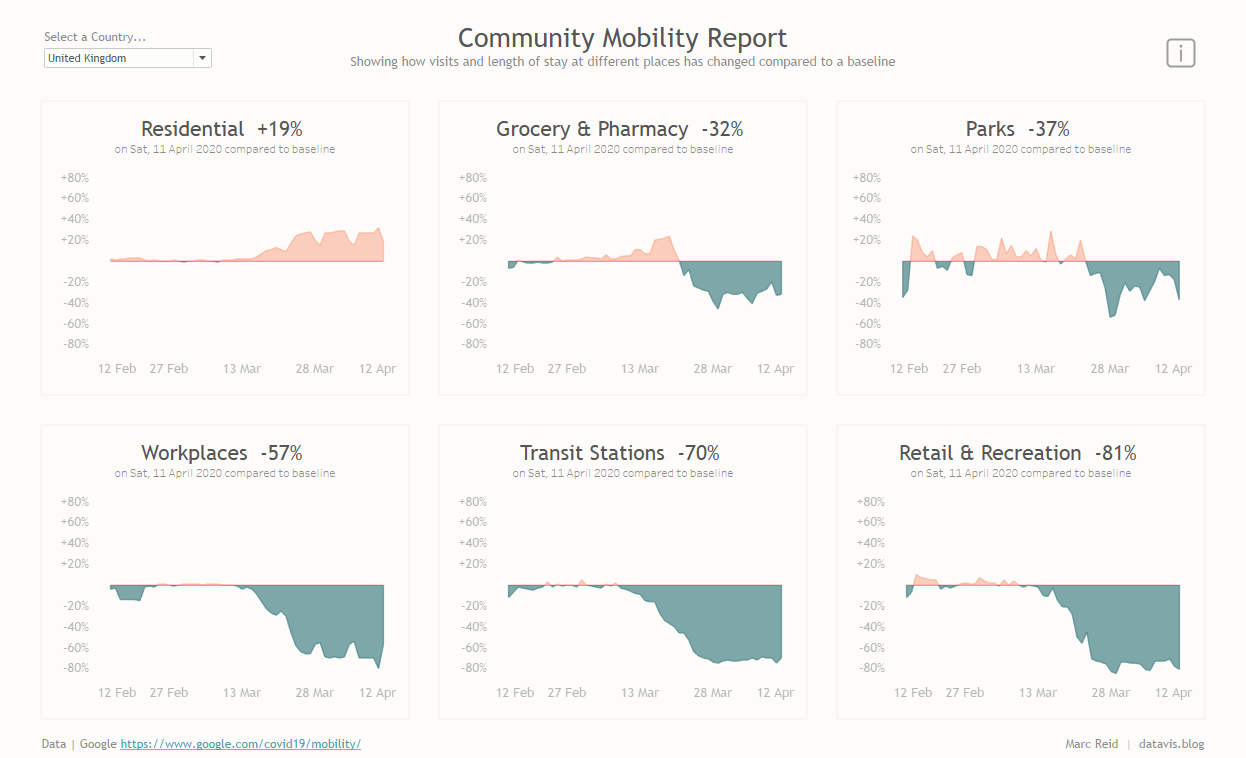
This blog post walks through some of the design and UX choices in making this visualisation about how different areas of the UK have responded to lockdown.
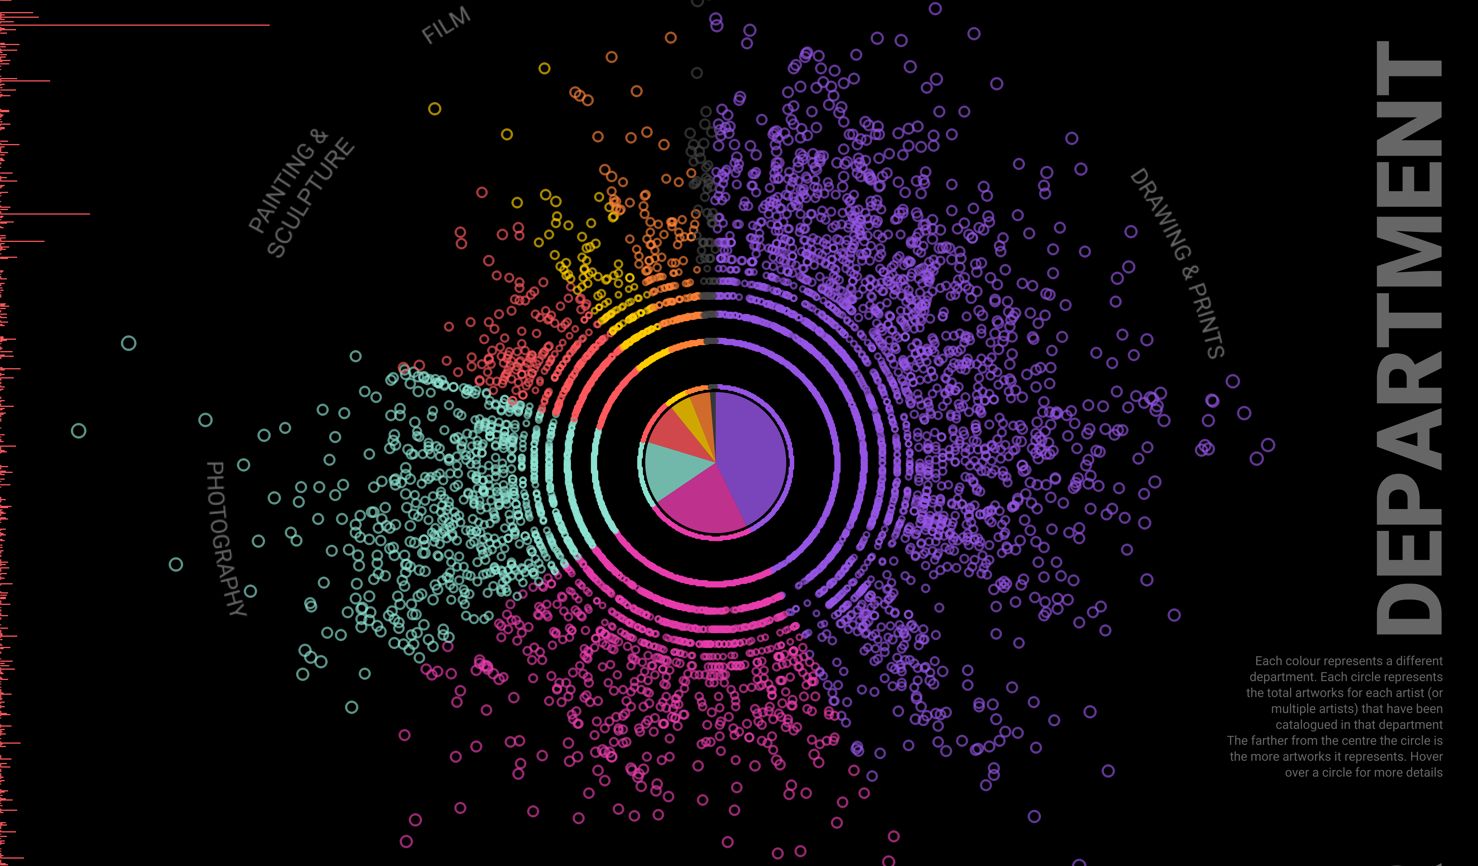
This blog walks through my process for visualising the 139 thousand records in the Museum of Modern Art's catalogued collection.
This blog posts steps through how to create a two-colour area chart, with a different colour for positive and negative values.
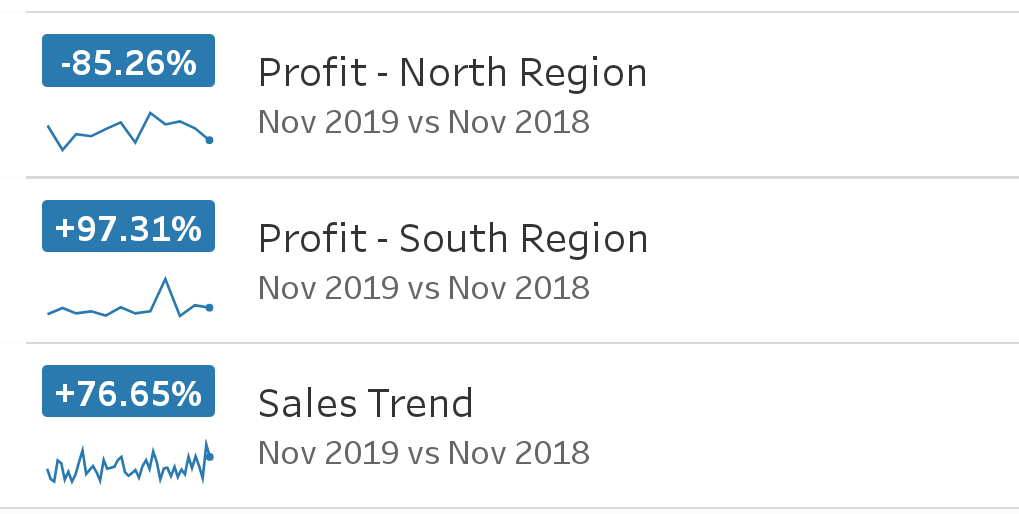
Tableau Metrics enable you to see KPIs and trends of various measures sourced from different dashboards in an easily digestible format that's optimised for mobile.
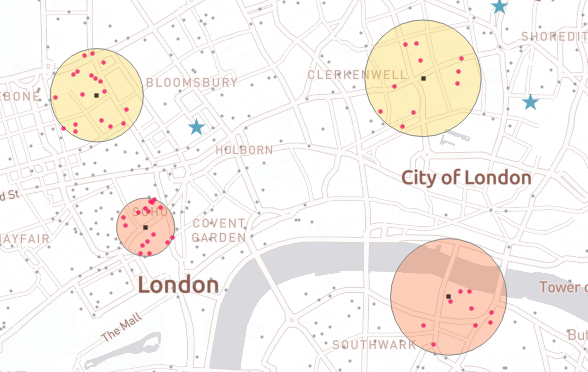
Buffer spatial functions allow you to perform trade area analysis in Tableau Desktop without any pre-processing of data. This blog explains what buffers are and how to create them.
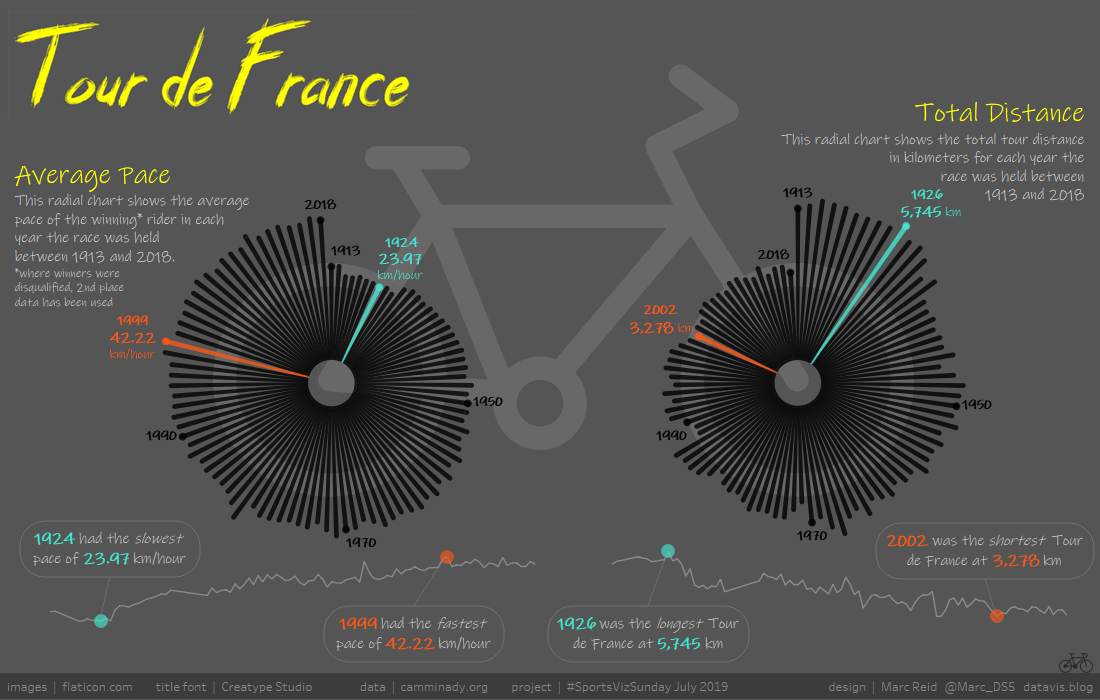
For this month's #SportsVizSunday and #SWDchallenge I created two radial charts as the basis for a bike themed Tour de France visualisation
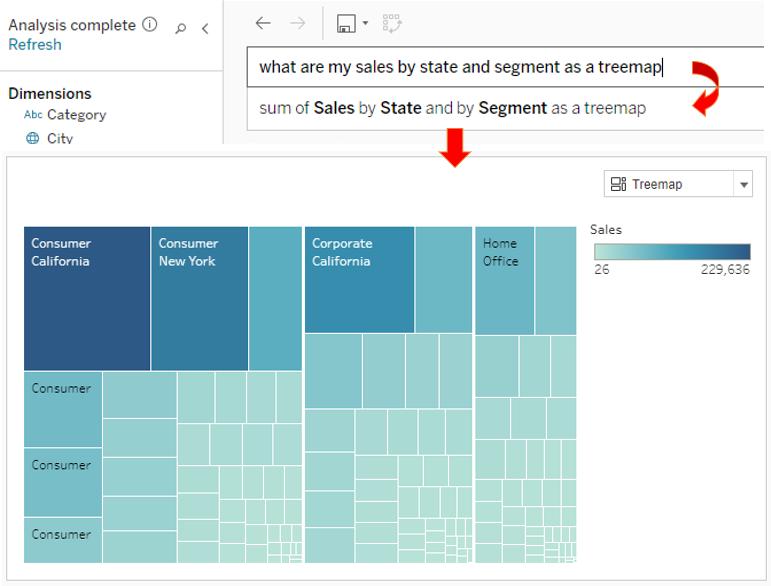
This post takes a look at Ask Data, the new functionality in #Tableau 2019.1 to be able to ask questions of your data using natural language.